

If you’re responsible for marketing at your software company, the answer to all your frustrations seems to be literally at your fingertips.
We can track behavior on our websites and emails, understand preferences on social media and Google search. We now have the ability to stalk every person that visits our website (and find out where they were before).
But with that comes an array of metrics and jargon – and sometimes we can get lost in this information overload.
In April 2021, I asked my LinkedIn network how they measure the success of their SaaS marketing campaign. This is what they said:
- 32% measure success in MQLs (hard conversions)
- 14% are happy with sign-ups (soft conversions)
- 11% measure other factors
- An outstanding 43% said revenue is the most important metric
So, for this article, we are going deep into SaaS metrics. We uncover what all these abbreviations mean and how to calculate them. We went from marketing to revenue metrics and interviewed software founders and marketing managers on their use of the most important metrics.
Emils Veveris from Lokalise gave thoughtful insights on what to track depending on the growth stage of your company:
“It largely depends on the maturity of the organization, the product, company goals and team incentives. There can be big differences between B2C, B2C, product-led vs sales-lead, high-growth, early-stage, VC-backed, bootstrapped, etc. (all SaaS).
My team is tracking (B2B SaaS):
- Top of the funnel metrics: traffic, leads
- Bottom funnel metrics: trials, demos
- Revenue: pipeline, new revenue, retention, and upsells
There are more metrics for the sales team and product. Ultimately you want to report and prioritize on revenue. That would be the main metric. ARR and new MRR.
Because it’s clear for everyone how well the team did this month, year, etc. MQLs can be misleading. Reporting on revenue is a bit easier for B2C but harder for B2B. For example, in most B2B, the revenue is delayed (there’s a procurement cycle), so you can’t instantly see the ROI.
But you can report on projected revenue (pipeline). Also in most cases, you’re likely an account-based and multi-touch, because you’re not selling to an individual. So you need to build complex systems to be able to report on revenue. Which frankly is not accessible to early-stage or bootstrapped SaaS.“
Key Saas Metrics To Measure Success
MQLs: Marketing Qualified Leads
Marketing Qualified Leads are leads that have come in thanks to your marketing efforts – SEO, Facebook Ads, PR. – and that have shown interest in your product. This includes free trials, test accounts, and demo requests.
However, if your software comes with a sales cycle that includes a sales call, your MQLs are not vetted and approved by the sales team as an opportunity yet.
Tracking your MQLs helps you figure out which of your marketing channels works best to bring in relevant leads. If you also want to know which of those channels generates the most leads that turn into customers, you’ll also need to track your SQLs.
SQLs: Sales Qualified Leads
A Marketing Qualified Lead becomes a Sales Qualified Lead once the sales team has vetted the company, industry, and budget.
Note that for tracking and clarity purposes, it’s important that you internally define which boxes a lead needs to check in order for you to consider them as SQL.
Conversion Rates
Each time a lead moves onto another stage in your funnel, you have a conversion. Asides from calculating how many of your leads turn into customers, you also want to track how well your lead generators are performing individually in your lead generation funnel. Some conversion SaaS metrics to track are:
- How many blog readers turn into email sign-ups soft conversions.
- How many email subscribers turn into MQLs.
- How many MQLs turn into SQLs.
- How many SQLs turn into paying customers.
Agata Krzysztofik from Piktochart knows:
“For SaaS companies, which use a combination of freemium and tiered pricing models, it’s essential to track conversions.
At Piktochart, one of our OKRs is around increasing free-to-paid conversion rates. We focus on initiatives that will help us incentivize freemium users to convert to our paid plans.
A low free-to-paid conversion rate can also be a good indicator of several problems:
- Your plans are priced too high.
- There is not enough perceived value in paid plans.
- You are acquiring the wrong audience (you should work on your product-market-fit).”
LVR: Lead Velocity Rate
The Lead Velocity Rate indicates how many qualified leads you’re generating month over month. It’s your lead growth rate and you can calculate it as follows:
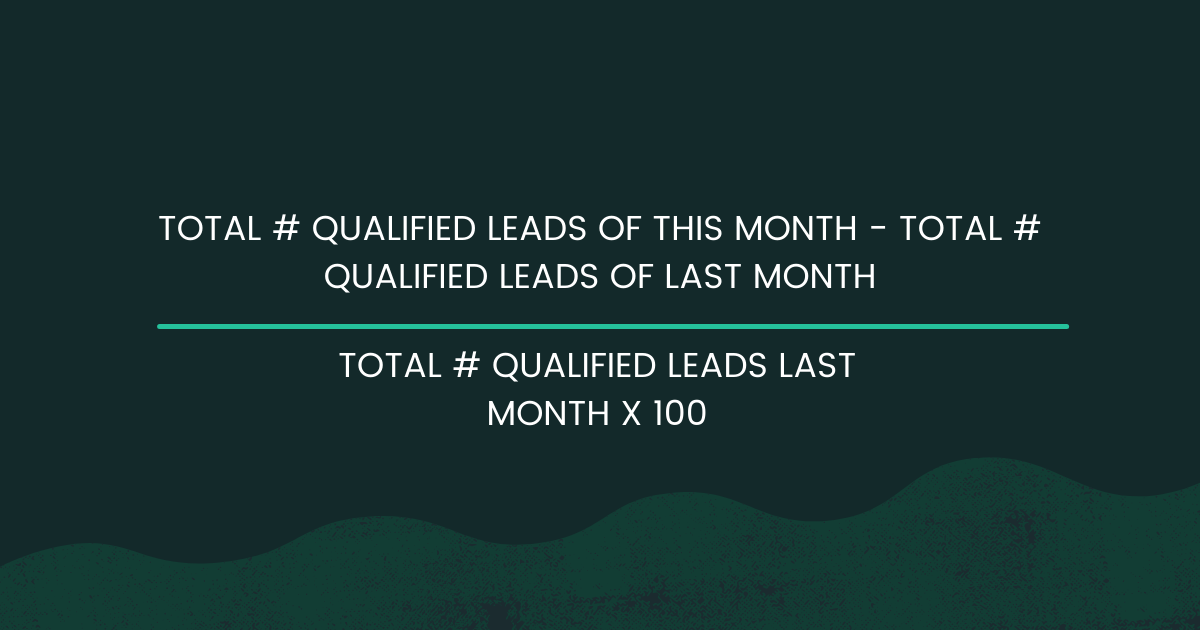
(Total # qualified leads of this month – total # qualified leads of last month) / (Total # qualified leads last month x 100)
Viral Coefficient
The viral coefficient is the number of new users an existing user is sending to your SaaS business. It indicates how willing your existing customers are to promote your product, and how successful it is when they do.
To calculate the Viral Coefficient, take the average number of invitations sent per existing user (these can be referrals, shares of your signed up, etc.) and multiply that by the average conversion rate of those invitations.
MRR: Monthly Recurring Revenue
MRR is how much revenue you get from the subscriptions of paying customers in any given month.
Note that MRR only consists of the monthly payments customers make to use your software. It does not include one-time onboarding revenue, consultation revenue, or anything that falls outside of the plans you offer.
While it is one of the key metrics for saas companies, the danger of focusing too much on pure MRR is that it doesn’t give an accurate idea of how well your SaaS business is doing. For example, pure MRR won’t tell you if you’re losing more customers than you’re gaining. Your MRR could be going up because part of your existing customers is upgrading their plans while others are canceling their subscriptions.
To get a better view of revenue movements, also calculate:
- New MRR: revenue generated in a month by only new customers
- Add-on MRR: also known as “Expansion MRR”, this is revenue generated from existing customers upgrading their plan, paying for extra users, etc.
- Churn MRR: revenue lost because users canceled their subscription
- Contraction MRR: revenue lost because users downgraded their subscription.
- Net New MRR: your total new revenue for the month. Net New MRR = New MRR + Add-on MRR – Churn MRR.
- Gross New MRR: your New MRR + your Add-on MRR.
- MRR Growth Rate: this shows how you’re improving your revenue month after month. It equals [(MRR of this month – MRR of last month) / MRR of last month] x 100.
Dixon Jones, CEO and founder of Inlinks.net recommends:
“We track Monthly Recurring Revenue until the business is swimming with liquidity.
It is easy to track (Stripe has it on the dashboard by default) and you can budget expenditure based on it.
I look at it almost daily… which might be obsessive, but it is a great way to see where you will be 2 months from now if you don’t move the rudder on your ship.
I also look at the number of “paying” and “monthly active” users (which includes free users) but looking at “registered users” is not a good metric. That’s like looking at a pile of dead batteries to measure how much energy you’ve put in.
ARR: Annual Recurring Revenue
Your Annual Recurring Revenue is sometimes also referred to as “Annualized Run Rate”. It offers a way to project how much revenue you can generate in a year, assuming you have and will maintain a positive retention rate.
ARPA: Average Revenue Per Account
Average Revenue Per Account or ARPA is also known as ARPU or Average Revenue Per User and depending on your subscription and billing model, it’s the average revenue you make per paying customer per month (most common for SaaS companies), quarter, or year.
To calculate your monthly ARPA, divide your MRR by your total number of paying customers.
ACV: Annual Contract Value
Annual Contract Value indicates how much an average customer is worth to your SaaS business over the span of one year. In essence, it’s the total value of a customer’s contract, divided by the number of years that contract is for.
However, there are many different definitions of ACV floating around. Some are based on calculating the ACV across all customers and contracts, while some look at the ACV per individual customer. Some include one-time payments such as signup fees while others don’t.
The definition of ARR above, however, is widely accepted and so you may choose to work with ARR but not ACV.
Churn Rates
There are two types of churn rate your SaaS business should measure: Customer Churn, and Revenue Churn.
Customer Churn Rate is the rate at which customers are canceling their subscriptions within a given period. If your customer churn rate is high or growing, that’s a good indicator that something is off. It might be that your product isn’t working the way it should, your customer support is slow to respond, or you have a competitor with a better offer.
To calculate your rate of churned customers, divide the total number of customers you lost in a given period by the total number of customers you had at the start of that period.
If your customers cannot cancel anytime – for example, because they’re locked into a year-long contract – it’s important to take that into account when calculating your churn rate. You can do that by following this formula instead:
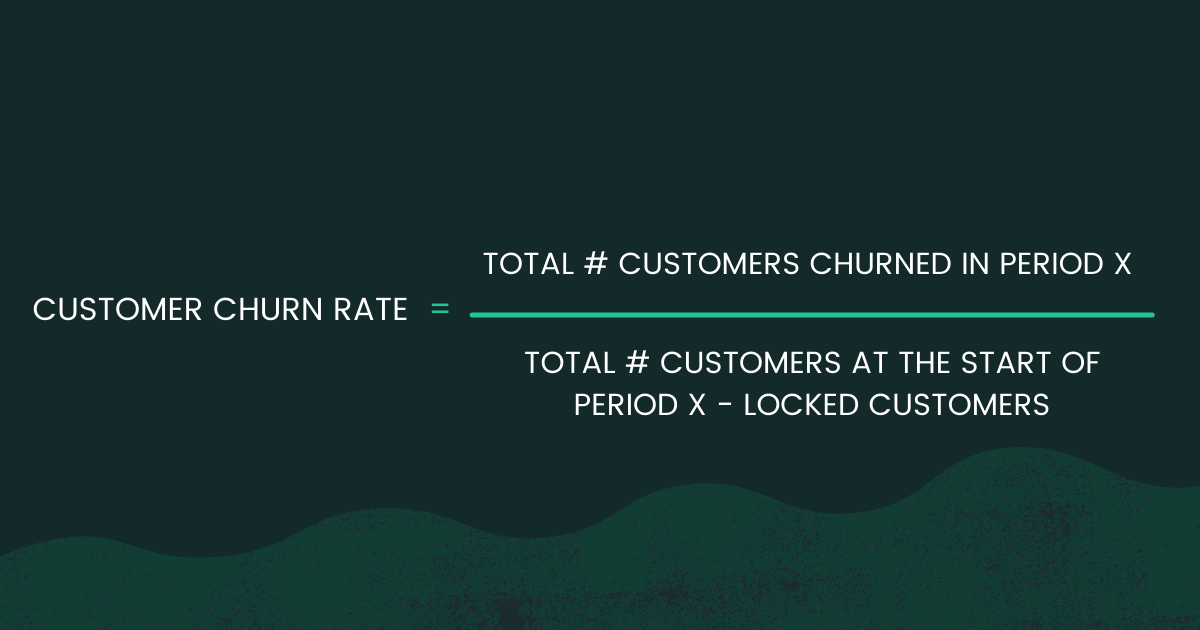
Customer Churn Rate = total # customers churned in period x / ( total # customers at the start of period x – locked customers)
Revenue Churn Rate is the percentage of revenue you lose within a given period because of customers canceling their plan and because of customers downgrading their plan.
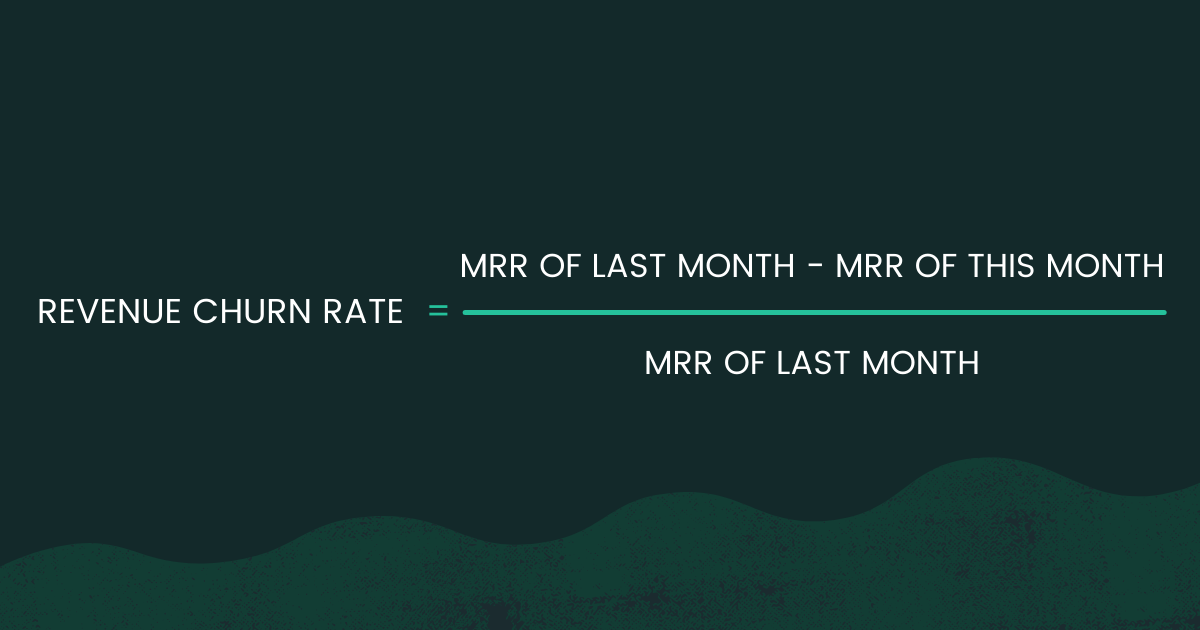
Revenue Churn Rate = (MRR of last month – MRR of this month) / MRR of last month
As mentioned before, the revenue loss or churned MRR caused by Customer Churn can be balanced out when remaining customers start paying you more for upgrades, additional features, etc.
This is called Negative Churn.
Rob Walling said about net negative churn:
“If recurring revenue is the golden ticket of software pricing, then net negative churn is the golden ticket of SaaS.
If you are purely feature gating and people are moving up and down based on the features they use, most of the time you won’t achieve net negative churn. Only when you find that value metric that people are building up over time (storage size with. Dropbox or subscribers with MailChimp) are you likely to achieve net negative churn.”
CAC: Customer Acquisition Cost
Your Customer Acquisition Cost or CAC is a crucial metric to track because it allows you to:
- Make sure you’re not spending more than you should on new customers.
- Figure out which of your marketing and sales channels are bringing in customers most cost-efficiently.
You should track both your overall CAC and your CAC per acquisition channel. To calculate your CAC, divide your total sales and marketing cost (overall or per channel) with your number of signups within a given period (overall or per channel).
Note that to calculate CAC, you’re taking into account both free trial/freemium and paying users. After all, you’re paying for these users whether they convert into paying customers or not.
The CAC Payback Period indicates how much time your SaaS company will need to earn back what you spent to acquire customers and break even. It’s calculated as follows:
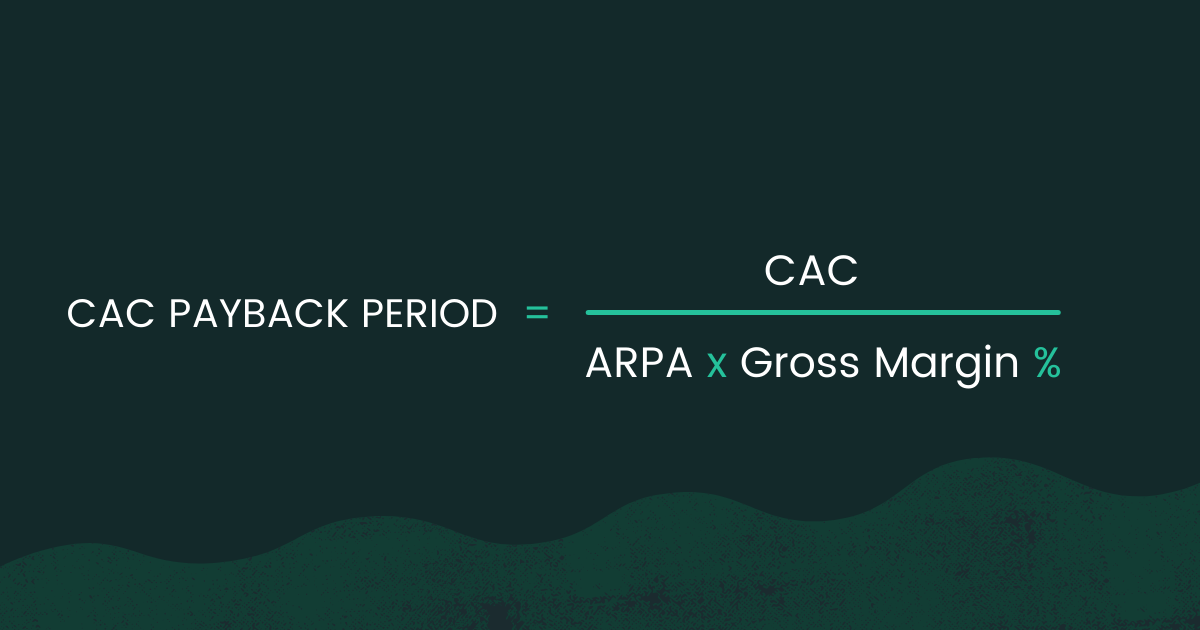
CAC payback period = CAC / (ARPA x % gross margin)
For your SaaS company to be viable, your average value per customer should be higher than your cost. That’s where LTV comes in.
CLTV or LTV: Customer LifeTime Value
To know the value of an average customer of the entire period that customer remains a customer, you first need to know how long your customers stick around on average.
To calculate Customer Lifetime, divide 1 by your Customer Churn Rate.
Once you have that number, your LTV = ARPA x Customer Lifetime.
Robin Copernicus, startup consultant at robincopernicus.com highlights:
“Customer Lifetime Value or CLTV is the primary metric we focus on for the startups I mentor in my startup consultancy at robincopernicus.com
We focus on CLTV because the time for someone to copy your product, service, and business model is decreasing.
As soon as you launch your product, service, or business model idea, you can expect to see an army of copycats on your favorite Ali-type site the next day.
When everything is same-same, the main point of differentiation becomes price, resulting in a price war. However, one element is irreproducible: your brand story and how that connects with your subscribers.
This connection is what keeps your customer from jumping to your competitor.
This retention-boosting feature is because your customer is willing to pay you more to maintain this connection with your brand. The best proxy to measure the strength of this connection is CLTV. Increasing CLTV means you are automatically optimizing every other in-funnel metric in your SaaS.
An increase in CLTV means increasing positive metrics such as MRR, ARPU, and NPS; while decreasing negative metrics such as revenue churn. An increase in CLTV means your leads are converting and staying with you and receptive to other revenue opportunities.”
NPS: Net Promoter Score
Net Promoter Score is a popular metric to measure customer satisfaction but it should be taken with a grain of salt. That’s because NPS simply asks customers to rate on a scale of 0-10 how likely they are to recommend your SaaS company. It doesn’t measure whether users also actually promote your product to people they know.
NPS calculations are somewhat complicated, which is why it’s best to use a tool like Drift or Delighted for them.
A better way to gauge customer satisfaction is by measuring your customer retention rate.
Customer Retention Rate
Your customer retention rate tells you how many of your customers keep using your product month after month. To calculate it, divide your number of existing (not new) customers at the end of the month by your number of existing customers of two months before.
Customer Engagement Score
That a customer keeps paying for your product, doesn’t necessarily mean that they’re actually using it. We all have subscriptions we haven’t canceled yet even though we rarely open the tools they’re for.
Your Customer Engagement Score indicates how actively your customers are using your software. How you’ll calculate that Score depends highly on the nature of your SaaS and what a normal activity level for any given customer would be.
Some things you can take into account are:
- How often they’re logging in.
- How long their sessions are.
- How often they reach the daily/weekly/monthly usage caps you may have set.
SaaS Quick Ratio
The SaaS Quick Ratio is an important metric that shows you whether your SaaS is growing in a healthy way by taking into account both revenue growth and decline. You can calculate it as follows:

SaaS Quick Ratio = (New MRR + Expansion MRR) / (Churn MRR + Contraction MRR)
Say that your MRR is growing by $500 every month. There are various ways that could happen. Here are two extreme examples:
- $500 New MRR – $0 churned revenue
- $5000 New MRR – $4500 churned revenue
Your revenue growth is the same in both cases, but in the second example, you need to generate $4500 worth of new revenue every month. That’s much less sustainable, if at all than generating $500 worth of new revenue every month.
Conclusion
This SaaS metrics guide, you can look up some of the SaaS metric jargon and pick the ones that matter most for your business.
These metrics can show you anything. From where you’re losing more customers than you’re gaining even though revenue is going up, or when your customer acquisition cost is too high to be sustainable.
They can also show you which lead generation strategies are working and which channels you may want to double down on.
Briefly put: Tracking the SaaS metrics mentioned in this article will help you fix issues that are stunting your growth while at the same time pointing you to opportunities.


